
New Adwords Quality Score Data Available, Time to Rejoice?
Last week I caught word of some new quality score information coming to Google Adwords. This new information was cause for major excitement, after all, information is power and what improving our paid search marketing programs is all about. I just couldn’t wait to log in and take a look. Here is an outline of the new information, straight from Google.
“Quality Score is based on past performance data
Quality Score is an aggregated estimate of how well a keyword has performed overall in past ad auctions. Based on this data, each of your keywords gets a Quality Score on a scale from 1 to 10, where 1 is the lowest score and 10 is the highest.
Null Quality Scores, designated by “—” in the table, appear when there aren’t enough impressions or clicks to accurately determine a keyword’s Quality Score.
Quality Score status columns
These status columns show you the 4 Quality Score values: Quality Score, Landing page experience, Ad relevance, and Expected click through rate (CTR).
These optional columns can be added in your keyword reports. You’re also able to see these scores in the text that appears when you hover over the keyword status icon speech bubble “()”.
Historical Quality Score columns
These historical columns let you see past data for all 4 Quality Score columns: Qual. Score (hist.), Landing page exper. (hist.), Ad relevance (hist.), and Exp. CTR (hist.).
Historical columns will reflect the last known score for the reporting period. If you apply the “Day” segment to your keyword reports, AdWords will report daily values that reflect what your score was at the end of each day. Note that historical data won’t be available in these columns for dates earlier than January 22, 2016. However, if you previously used a third party or scripts to download historical Quality Score data, these should remain unaffected and this data will still be available.” (source: https://support.google.com/adwords/answer/7050591?hl=en).
So, in summary, Google is now offering insight into quality score, landing page experience, ad relevance and expected click through rate plus a view of historical performance in these four areas. My cause for celebration is that we can now see our historical performance and current performance in one view to see what effects our changes are having in these areas. Awesome, right?
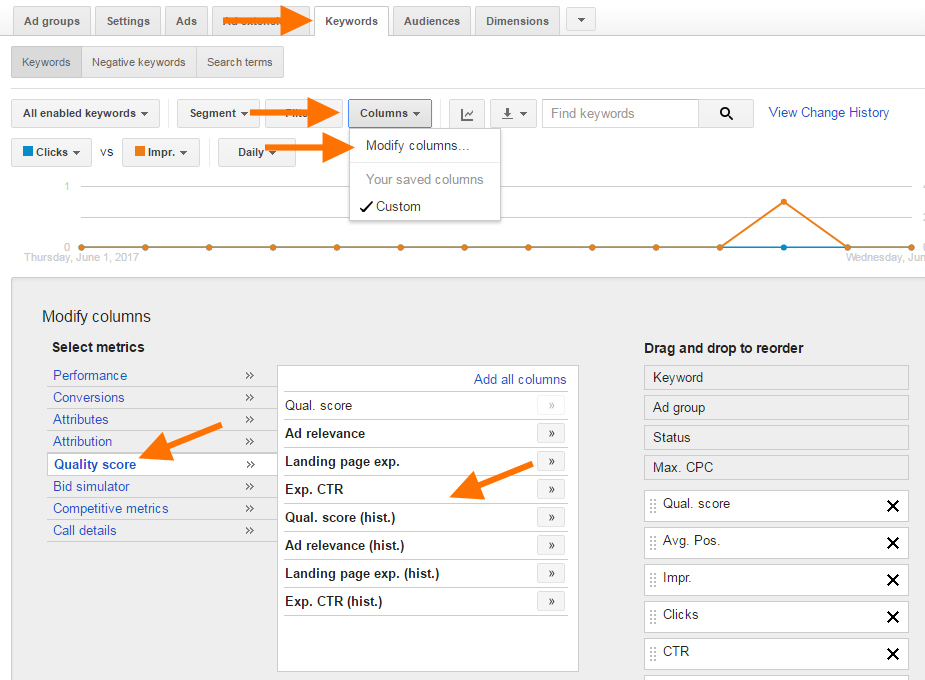
That’s what I thought, until I logged in and added these columns to my dashboard. Before I get into why, here is where you can find and add the new quality score information to your keyword view. Simply go to your keywords tab, then click the columns drop down and select modify columns. On the modify column screen click on quality score. You will find all these new categories available to add and save into your view. Below is a screen shot highlighting the process.
In addition to viewing this information on your dashboard, you can dig into movement in the metrics by segmenting by month, week and day to give you a picture of what direction your quality scores are moving.
OK, now that we’ve covered what and how, let’s dig into how my excitement turned into disappointment. First, where they got it right. Quality score, as we all know, uses a grading scale of 1 to 10. This makes looking at movement a somewhat precise exercise. If we have a keyword with a quality score of 3 and we make improvements that move it to a 5 we know we are moving in the right direction but have more work to do. In the same scenario if we move from a 3 to an 8 we know our changes had a major impact and we need some additional massaging. This is very powerful information when grading our improvements and their impact on quality score. Perfect!
However, that is where the good news ends for the most part. Below is a screenshot, see if you can figure out why I’m so disappointed.
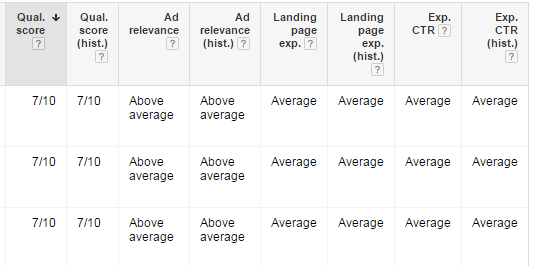
In case you missed it, Google decided that instead of a 1 to 10 scale for grading your ad relevance, landing page experience and expected CTR they will utilize a 3 tier scale of below average, average and above average. Now don’t get me wrong, this information is still helpful, but how are we to know if we are at average but very close to above average and a change we make brings us to just outside of below average if the result is still just average?
Google is most likely using a different scale then the one they are showing here so let’s pretend it is a 1 to 10 scale. If average is a 4-6 we could be at a 6, make a change that drops us to a 4, and Google will simply report us as average. We have no idea the change we just made had a negative effect due to the way they are presenting the information. In my humble opinion this is a huge mistake on their part.
So what can we learn from all of this? Well, more information is certainly better, and I for one am happy to have it and will use it as I can. The additional quality score information is the best and should provide us with insight into smaller movements better or worse. The rest of it will be nice to have and something we’ll use when it is helpful, but with only larger movements in performance changing the scale I doubt this will be as useful as it could be. Your mileage may vary.